
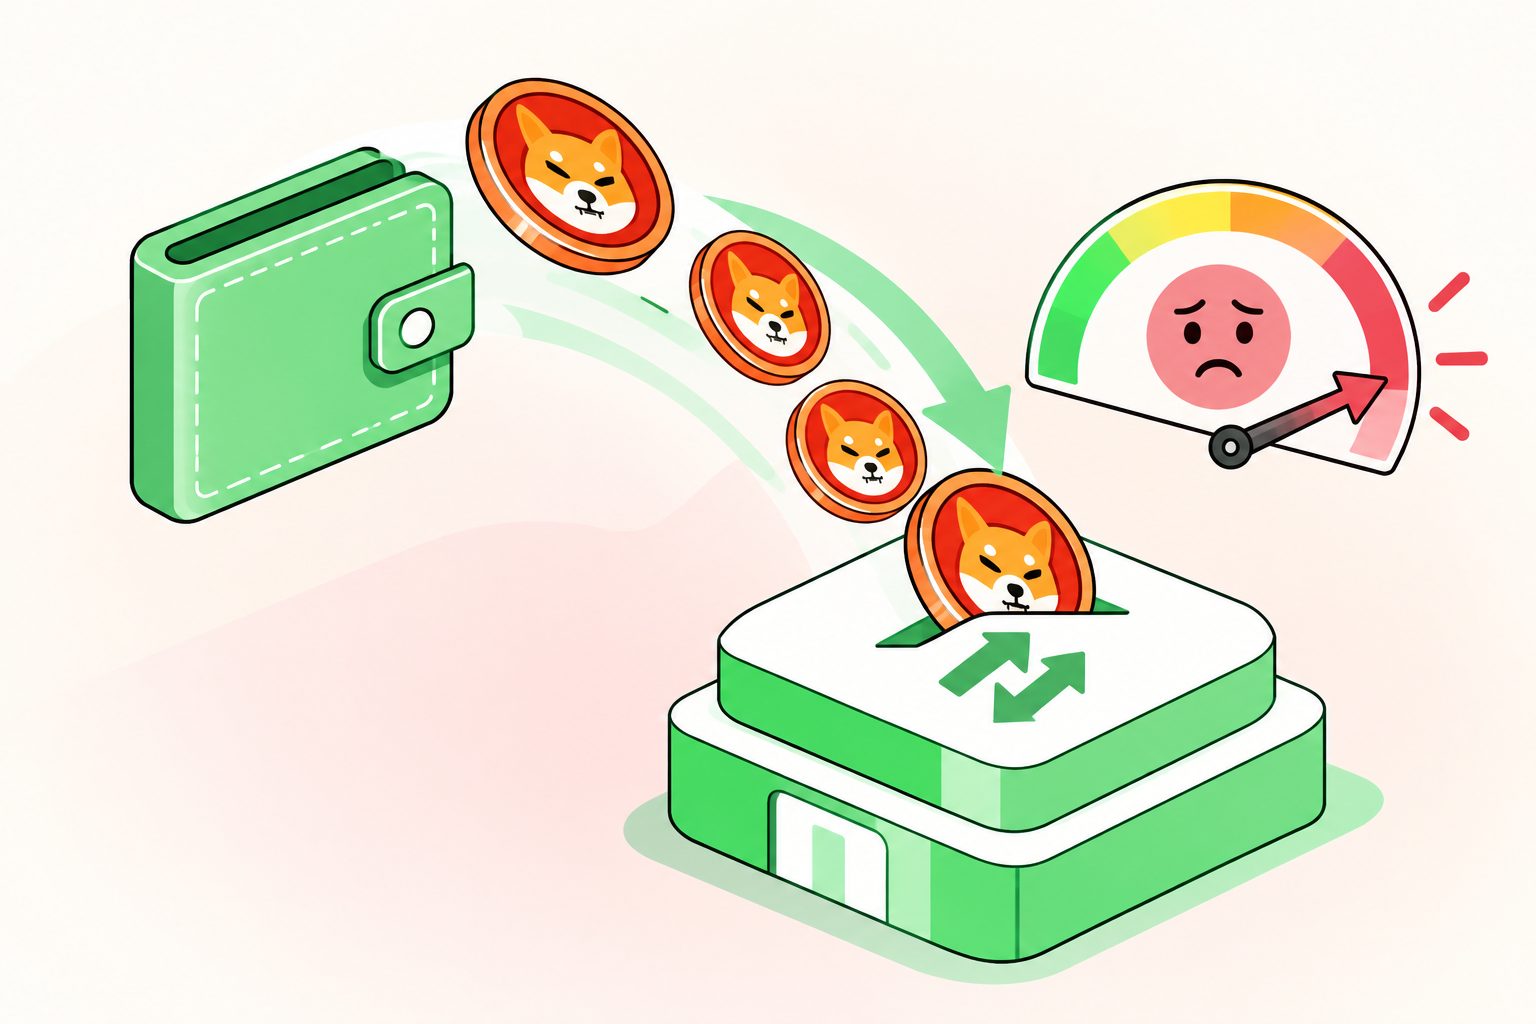
Large holders moved a net 155 billion SHIB onto exchanges in 24 hours, adding potential sell-side supply as the token remains below both major moving averages. SHIB is oversold, but the downtrend persists and $0.0000034 is the key support floor identified in the analysis.
CryptoQuant recorded about 496.3 billion SHIB deposited and 341.3 billion withdrawn. Exchange reserves rose roughly 0.18% to 85.89 trillion SHIB, while their dollar value fell about 5% to $316.9 million as the token price declined. The seven-day average deposit increased about 86% to 1.72 billion SHIB; the latest mean deposit was around 2.76 billion, and the ten largest holder wallets accounted for about 10.86 billion SHIB in activity.
Flows have reversed before: net deposits were 77.3 billion SHIB on Oct. 23, but net withdrawals reached 95.7 billion two days later and 312 billion on Nov. 17. Depositing tokens does not confirm a sale. Market sentiment was also weak, with the Fear & Greed Index at 12 on Nov. 21. Shibarium recorded 546 transactions on Nov. 20, down from 6,370 three weeks earlier.
SHIB was near $0.0000036, up about 1% on the day but down around 15% over seven days and 30% over a month. It had failed to break $0.000004 on Binance on Nov. 20, extending a pattern of lower highs. The 50-day moving average was near $0.0000046 and the 200-day near $0.0000053; the price was below both, with the 50-day line roughly 25% higher. Resistance was identified at $0.0000043, then around $0.0000048.
Daily RSI was near 26, below the 30 level commonly considered oversold; that can precede a relief bounce, but does not establish a bottom. MACD remained below its signal line, while thinning trading volume suggested fresh buyers had yet to appear. The Nov. 20 low, around $0.00000365, came close to the $0.0000034 floor, below which the analysis found no mapped support. A break could leave a thin market exposed to additional selling; if support held, holders might wait for better prices. The bullish scenario requires fresh demand to absorb exchange-held tokens and a move through resistance, while a clean break below support favors the bearish case. Withdrawals by whales would reduce the immediate selling risk.